
Additionally, evidence that 2002-2007 was nothing more than a bear market rally can be derived from the failure of the market to make a new high in anything other than dollar terms. This suggests that real stock values were falling, and it only appeared as though stock values were rising because of the false measuring unit, the U.S. Dollar. Gold is real money, and the dollar is not, but rather a debt instrument that is built on a giant inverted pyramid. Please see prior blog posts for more on this phenomenon. I have also laid out clear technical evidence for this rally since 2009 being a bear market rally, or a rally in the context of a secular bear market. Again please see prior posts for a detailed analysis.
The most probable scenario is that the Bull Market ended in 2000, illustrated below:

It is highly unlikely that the Bull Market ended in 2007, due to the fact that evidence suggests the entire rally was based on credit inflation and the drop in the value of the U.S. Dollar. It was much more likely a B wave of an expanded flat correction from 2000. Expanded flats are a corrective wave form, and this one was either the first leg down of a bear market (most probable), or a fourth wave correction.
If it represented a fourth wave correction, the it was either of primary degree or cycle degree.
The bear market from 2000-2009 was too small to indicate a correction of supercycle degree, in addition to the fact that, as illustrated before, valuations were simply not indicative of a secular bear market bottom on a historical basis. This was also the case in 2002, which wasn't a secular bear market low either. Therefore, the 2009 low indicated either Cycle wave a of an ongoing supercycle bear market, or Primary wave 4 of the bull market that began in 1974. Although evidence doesn't support the latter count, it is important to remain objective.

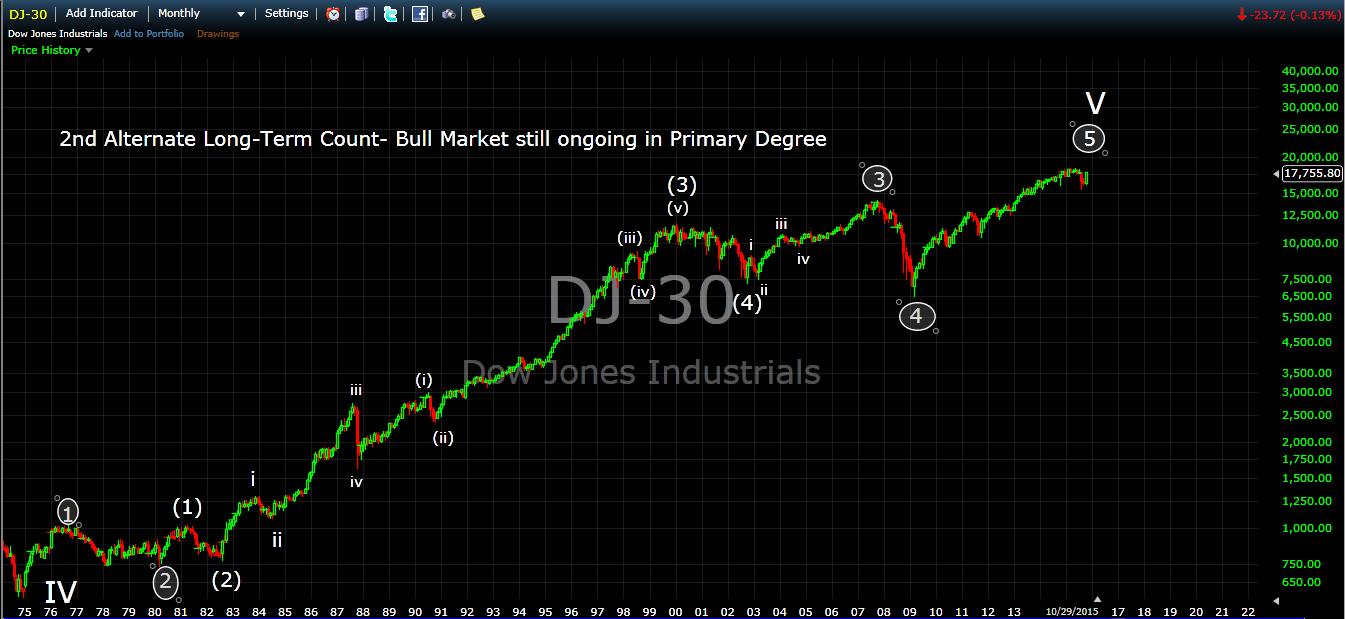
Yet another possibility, presented by Patrick, a member of a private investor group, is that the bull market is still ongoing, but counts the 2002-2007 bull market as an impulse wave:
One last possibility, I discovered while constructing long-term Elliott Wave channels, is that the Bull Market is still ongoing in cycle degree. This would mean 1974 did not mark a cycle degree low, but rather a low of primary degree, and 2009 marked a cycle wave IV low. Supporting this potential count is the fact that the advance from 1932 channels well (EWP, p. 71), with the exception of the period between 1974 and the mid-1980's, where price remained below the lower trend line. This count would not be completely outside the realm of possibility, considering this period of time the market spent below the lower trendline was a period of deep skepticism of the market's ability to advance. Meanwhile, during early 1980's,the market was tracing out clear impulse patterns in a true secular bull market. Perhaps the primary reason I decided to present this possibility is the clear alternation between wave II and IV, satisfying the guideline of alternation.

Despite my convictions that the bull market ended in 2000, I have presented three alternate ways of interpreting the market from an Elliott Wave Perspective, in both Cycle and Primary degree. The post directly preceding this one, found by CLICKING HERE, included a detailed quantitative analysis of the market and presented the recent high in May 2015 as potentially marking a very significant high. This would be especially relevant if 2000 was indeed the end of the great secular bull market that began in 1974, as it incorporates the two rallies in this secular bear market period. If the secular bull market is still ongoing, the ratios presented in that analysis would no longer be valid, because 2009 would have marked a new leg in the ongoing bull market, but NOT a new secular bull market. This serves to complement the new high that would likely accompany the market, as the existing high would be surpassed, negating the current mathematical basis for termination of the rally.
Internal Structure of the rally assuming calculated ratios hold:
Triple Zigzag correction from 2009:

One last possibility for the corrective count that would allow for a new high, and possibility still the validity of aforementioned ratios, is that the last leg of the rally topped in September 2014, and the May 2015 high was a b wave as part of an X wave separating the second zigzag from the third. The market would then stage a dramatic downward reversal after a minor new high.

I detailed in a post back in 2014 why, from a pure Elliott Wave Perspective, the internal structure of the rally did not count well as an impulse. This would serve to refute the rally that began in 2009 as a bull market. Please see a link to that post below:
http://fifthwavefinancialanalysis.blogspot.com/2014/12/an-in-depth-elliott-wave-analysis.html
However, again remaining objective, should the market start impulsing up from the August low, it would likely be a fifth wave in intermediate degree from 2009, and the ensuing high would represent the top of Primary Wave 5, Cycle Wave V, Supercycle Wave (V) and finally finish off the Supercycle Bull Market. In this scenario, the market could accelerate upwards, ending with a blowoff top into 2017 to complete a Fiboncacci 8-year bull market, just as in 1929.
No matter how one counts the advance off the 2009 lows, the rally is terminal and the market is approaching a VERY significant top, following which should be a dramatic deflationary collapse that takes the majority of economic and financial commentators by surprise. The decline will go down in history as being the most significant in United States History to date.

Once again, we have a situation where a cyclical market bottom is being proclaimed throughout the investment community as a "generational low". It wasn't a generational low, and nor did it serve to properly correct the excesses that have built up throughout the 1980's, 1990's and early 2000's. What has occurred, is that central banks have attempted to solve the debt problem with more debt. We haven't solved any of the debt issues, but rather made them bigger. First, from 2002-2007 in the private sector, and now in the public sectors, educational loan sector, and auto loan sector. All of these are bubbles that will end the same way as the housing bubble, in total disaster. Except this time,the whole fraudulent debt-money system will collapse, and central bankers will be powerless to stop it.
Some proclaim the next crisis won't involve a banking crisis, however it would appear that evidence points to the contrary. Banks and companies are leveraged up again just as they were before the last crisis, except this time, both with debt and their own stock, repurchased on leverage. When the tide turns for good, forced liquidation of securities and major liquidity issues will once again present themselves. The banking system nearly collapsed in 2008. This time around, it will collapse. Because this is a developing Grand Supercycle Bear Market, social mood will reach such deep lows that will witness economic damage, social and political unrest FAR worse than anything seen during the 1970's secular bear market, and is likely to prevent any more bailouts, especially of private institutions. Political tension, from both the far left and far right, is currently increasing to institute major change. This tension will only become tighter and the backlash even more severe as the initial supercycle collapse, in progress since 2000, concludes. This final portion of the supercycle collapse, cycle wave c, will take the market below the 2009 lows. It will be breathtaking, and we will see things unfold in financial markets that have never before been witnessed since the inception of the Dow Jones Industrial Average in 1896, including absolutely unprecedented volatility and confusion as investors panic.
The Bull Market in valuations certainly ended in 2000. It is abundantly clear that optimism has stayed elevated throughout this whole 15-year topping process, with the exception of the late 2007- early 2009 period. The secular bull market certainly ended qualitatively in 2000 with the peak of true economic growth. As illustrated before, the bounce into 2007 was based on credit inflation, masking the collapse in real values that was taking place. What didn't end, is the topping process and elevated optimism. Some might say the 2007-2009 period was enough to qualify as a supercycle bear market, as it represented the largest percentage decline since the last supercycle low in 1932, suggesting it could have corrected the entire supercycle advance from 1932. From a pure quantitative perspective, this is true, but bear markets represent more than declines in the stock market. Secular bear markets serve to correct systemic excesses, and in this case, the highest degree of debt excess in history. Additionally, true secular bear market lows always include undervalued markets. This secular bear market has not accomplished it's goals yet, and if anything, the central bank's interference has extended the already insane levels of optimism and debt. From a causal perspective, however, rather than the central banks "causing" the extended rally in the stock market,the degree of a peak that is developing, a Grand Supercycle peak, is consistent with central banks tampering with credit and trying to hold an unsustainable system up. Put another way, rather than central banks manipulating people to take on more credit, a society that is developing a large peak in economic progress exhibits unusual and historically extreme optimism, which thus allows central banks to exist and inflate. While there was no crystal ball in 1982, and no analyst could have known for sure just how far and how long the mania would go on, the current juncture, rather than being viewed as bizarre or impossible, should actually be expected and embraced, as it simply serves to confirm the exceptionally large degree of a top that is developing, just as R.N. Elliott originally laid out, when he foretasted the rally to last all the way until the year 2012. The precision he accomplished is remarkable considering he made the call over 70 years ago.
When the bear market intensifies and the debt-money system collapses, central banks will come under fire and get the blamed for it all, when in fact cycles were behind it. In this case, there is a direct cause, the central banking system inflating credit at insane levels, and an indirect cause, the developing Grand Supercycle Peak in optimism, social mood and thus economic progress. Contrary to popular belief, it is actually the indirect cause that is relevant, since it gives the analyst context and a basis with which to predict probable future outcomes. This causality has not yet been accepted by the vast majority of social theorists, and certainly not by the vast majority of equity strategists. It has, however, been discovered and heavily researched by social theorist and market technician Robert Prechter of the Socionomics Institute and Elliott Wave International. As the Grand Supercycle bear market progresses throughout the 21st century, this new science is likely to become more mainstream. For more on this breakthrough fascinating new way of viewing causality, please visit the Socionomics Institute's website by CLICKING HERE.