
Monday, December 17, 2012
Elliott Wave Count Update
We have a potential completed Elliott Wave Count off the March 2009 low. It counts well as a double zigzag in a cycle wave B bear market rally. Of course, nobody believes it is just a bear market rally anymore, but the goal of bear market rallies is to convince all market participants that it is a new bull market. I would say the bear market rally has done its job, to say the least. We truly do live in interesting times, with historical extremes being reached in global finance.

Monday, December 10, 2012
Wednesday, December 5, 2012
Tuesday, December 4, 2012
December 3, 2012 Interview with Tim Wood and Bob Prechter
On Monday, December 3, 2012, I had the pleasure of interviewing two very respectable analysts, Tim Wood and Bob Prechter. I enjoyed every moment of it and hope everyone reading this blog will too.
Click Here to Listen
Click Here to Listen
Saturday, December 1, 2012
November 30, 2012 Interview with Tim Wood
This week we discuss DNA markers, Dow Theory, Elliott Wave and the relationship between these technical tools. We have a very special guest joining us on Monday, December 3, so stay tuned for that.
Click here to listen
Click here to listen
Saturday, November 17, 2012
November 16, 2012 Interview with Tim Wood
In this pre-holiday shortened interview we discuss the U.S. Dollar, Tim's cycle work, foreign markets and more. We will be back after the holiday break and I wish everyone a Happy Thanksgiving.
Click Here to Listen
Click Here to Listen
Saturday, November 10, 2012
November 9, 2012 Interview with Tim Wood
This is the third installment in my Interview with Tim Wood. Stay tuned for more, we have some interesting topics planned for the future.
http://www.cyclesman.net/wp-content/uploads/2011/01/ChrisWallace1109121.mp3
http://www.cyclesman.net/wp-content/uploads/2011/01/ChrisWallace1109121.mp3
Tuesday, October 30, 2012
A Potential Dow Theory/ Elliott Wave Map
In studying Dow Theory, one will find that bear markets consist of 3 phases. A Phase I decline, followed by a rally separating Phase I from Phase II. What follows is the Phase II decline, worse than Phase I. The market then stages another rally that serves to separate Phase II from Phase III. Then, the final portion of the bear market, Phase III, unfolds. I need to make clear that Elliott Wave and Dow Theory have absolutely nothing to do with each other. However, I believe they can be used to complement each other. The following chart has both Elliott Wave and Dow Theory Labeling on it. Each 4-year cycle low is marked with a Green "4", along with the appropriate Dow Theory phasing. Being that the last 4-year cycle low was 2009, the next one should ideally be sometime in 2013, and should carry price below the March 2009 low. Such a decline would likely find support at the lower trend line to mark the Phase II Low. A rally would then ensue, which I label Primary wave 2 up. I believe an extremely left-translated 4-year cycle rally will then follow. What is meant by "left-translated" is that the market peaks prior to the center of the cycle. This holds greater bearish potential as it leaves more time and thus greater downside price damage potential in the cycle, from low to low, for the market to decline. I believe the Phase III decline will consist of the worst portion of the bear market, and in Elliott Wave terms Primary waves 3 down, 4 up, and 5 down to complete cycle wave c and the bear market. The cycle wave c and supercycle bottom should be accompanied by good valuations typically found at true bear market lows.

This will be the buying opportunity of a life time. This mapping is not to scale in time or necessarily price, purely speculative, and is only a guess. Either way, I do not think the worst is over and the remainder of the bear market will be much worse than the 2007-2009 decline. Safety is the key during this vicious bear market. Those who remain prudent will have the capital to invest when the bear market is finally over.
Note: For more complete Elliott Wave Labeling, please see my October 8, 2012 post.
Note: Please visit www.cyclesman.net for Tim Wood's cycles and Dow Theory analysis. He is among the best and most objective technical analysts out there.
Saturday, October 20, 2012
Monday, October 8, 2012
Potential Long Term Wave Counts
The market is in a similar position as late 2007. With October 11, 2012 being a Fibonacci (5) years away from October 11, 2007, the day the stock market registered its all-time high, many divergences are present, such as the Dow Theory non-confirmation ("major" flashing red signal) yet the market keeps on crawling higher. Since the Dow Jones Industrial Average, the bellwether index, has retraced over 90% of the 2007-2009 decline, it can now be labeled as a flat. No matter what waves the market creates going forward, it is quite obvious the structure from 2009 is corrective. However, corrective Elliott Waves can take on many different forms, a flat being one and an expanded flat another. In the flat scenario, wave b must retrace over 90% of wave a, and that level was 13,425 on the Dow. Since the high so far is 13,661, the market now qualifies for a flat. Should the market be tracing out an expanded flat cycle wave b scenario, the market would make another all-time high, likely be completing an expanding wedge, and then crash in a cycle wave c down. Below is an illustration of such a scenario.

This would be under the expanded flat scenario with the market making new all-time highs. The market does not have to make new all-time highs in what could also be a regular flat, which does not require a new high. Either way, the upside seems very limited and the downside risk extremely high in what could be a Grand Supercycle Bear market.
As a side note, R.N. Elliott ,the original Pioneer of the Elliott Wave Principal, projected the Grand Supercycle degree top in...you guessed it...2012. While the market has really been in a bear market in every other denomination but nominal terms since 2000, 2012 may be of great significance as the final peak in the decade-plus long topping process is completed.
Monday, August 13, 2012
My Interview with Tim Wood
On Friday, August 10, 2012, I had the pleasure of being interviewed by Tim Wood, an excellent market technician whose focus is on cycles and Dow Theory. A link to the interview can be found below.
The interview can be found here.
The interview can be found here.
Monday, June 25, 2012
A look at the Crude Oil Market
Back in July 2008, with Crude Oil trading at an all-time high of $147 a barrel, everyone was calling for "peak oil" and a move to $200. This happened to be the end of the Crude Oil Bull Market from 1998, and probably dating back decades and even centuries. Well, instead of oil soaring to $200, it collapsed 78% in one of the biggest commodity busts of all time. It bottomed in 2009 at $33 a barrel. Since then, Crude has more than tripled in a wave B bear market rally. Crude topped over a year ago, at just under $115 a barrel. Of course, this got everyone in the peak oil camp excited again. But, it was just a bear market rally that is now over. Crude retraced 71.6% of its 2008 decline. That is more than enough for a bear market rally. Crude Oil has now entered the next leg of its bear market, wave C down. Granted, it is oversold in the short-term and due for a bounce...but Crude's long term downtrend remains in force.
 |
| Crude Oil Futures |
Thursday, June 21, 2012
The Return of Deflation
I think it is officially safe to say deflation has returned and the 3+ year reflationary bear market rally is over. Oil and commodities are collapsing, the stock market has turned to the downside, after horrendous technical conditions and non-confirmation warning months in advance of this top, and all you hear from the pundits on television is "don't panic, this is not a time to sell". They will be saying that all the way down until the bear market low, just as they did from 2007-2009. Except this time, its wave C of the bear market, and should be stronger, last longer, and ultimately do much more damage. Neil Cavuto recently interviewed Bob Prechter again. Once again, another great conversation with excellent unconventional insight.
Tuesday, May 15, 2012
Monday, May 7, 2012
A look at the long term Nasdaq 100 index
The Nasdaq 100 Index (NDX) has approached major long-term resistance. It fell just short of the 50% retracement of the 2000-2002 crash, at 2,805.80 and is backtesting a long-term trendline. After a 10-year bear market rally in this index, this seems poised to turn down in a big way. I posted about the parabola in Apple Inc. (AAPL), and as soon as this stock really gets going to the downside, the NDX should follow suit, as well as the general stock and commodity markets as the coming deflationary crash gets underway.


Thursday, April 19, 2012
Jim Puplava Interviews Bob Prechter
Great Interview....
http://www.netcastdaily.com/broadcast/fsn2012-0322-1.mp3
http://www.netcastdaily.com/broadcast/fsn2012-0322-1.mp3
Tuesday, April 3, 2012
Under the hood of the market....not a pretty picture
The market has now risen over 32% from its October 2011 low of SPX 1074.77 to an intraday high of SPX 1422.38. The Transports are diverging with the DOW. The Transports have not confirmed the DOW's rise above its May 2011 high. We have potential divergence setting up on a monthly basis. Volume has been declining since the rally began last October. In addition, the entire rise since March 2009 looks like a rising wedge, and we have a more pronounced rising wedge since October 2011. This bear market rally has now gone on for over three years, and it looks like its about to come to an abrupt end. The end of this cycle wave B Bear Market Rally and the return of the larger bear market that began in October 2007 should be imminent. Very few believe it is a bear market rally anymore. This is to be expected at the top of a cycle B wave.


Friday, March 30, 2012
The College Tuition Bubble
Many wonder why college costs so much these days. Could it be the value an education adds? Could it be "Rising Inflation"? The answer to both of these questions is an emphatic NO. The real reason college tuition costs are up is because there has been an enormous amount of Inflation. No, not CPI inflation, but credit inflation courtesy of the government and the Federal Reserve Private Banking System. One of the first financial markets that this scheme showed itself in was the NASDAQ bubble. Then it crept into housing and that ended badly in 2006. Then it found its way into the stock market and commodities. We all know how those ended. Well, one market it is certainly present in is the education loan market. The government has decided that everybody should receive a college education, so it has extended massive amounts of credit to those in need. Ironically, it is this very act of lending that has bid up college tuition prices. This is very similar to the housing bubble and will end the same way. This lines up well with my forecast for a deflationary collapse. This will bring down education costs when people can no longer get credit to keep education costs artificially high. The same is true with the market for healthcare. But I'll save that discussion for another time. For now, please view this very informative interview with Robert Reich, Public Policy Professor at University of California Berkley.
Monday, March 19, 2012
A Comment on Current Market Sentiment
CNBC today Featured Nassim Taleb who said he has "no choice but to own stocks" to "preserve my financial situation." He is trying to hedge against hyperinflation. Funny, that this article comes out AFTER the markets have already risen 100% from their March 2009 lows. I will bet Mr. Taleb wasn't saying he has "no choice but to own stocks" after the market had fallen 58% from their October 2007 highs on March 6, 2009. But now that the market has risen substantially, he is bullish. Of course, March 2009 is exactly the time that everybody who is bullish now should have been bullish and "worried about hyperinflation", but instead they were worried about deflation and a depression. I agree with Mr. Taleb in his worry about the financial future and his support for Ron Paul, as he is one of the ONLY politicians that has the slightest understanding of what is really going on, however I believe Nassim is very wrong about his assessment of the financial assets to own. I see deflation is a much bigger threat than hyperinflation, but, naturally, hyperinflation is on everyone's minds now. By the time the market makes its final low for this bear market, everyone will see Deflation as the major threat. That of course will be the time to be worried about "hyperinflation", which may or may not occur. But that mindset will do investors much more good at the bottom than now, as financial assets will be severely undervalued by then, probably more undervalued than they were in 1932. Not to mention some famous bears have also capitulated as well. That includes Nouriel Roubini, Zero Hedge, and David Rosenberg. Many sentiment measures are at more extreme levels than the all-time high in 2007 yet the market is not at a new all-time high. With the U.S. Dollar set to commence a major bull market and deflation straight ahead, the sentiment picture now is the mirror opposite of March 2009, which makes the conditions ripe for a major top.
Thursday, March 15, 2012
The 12-year stealth Bear Market
Whenever someone logs onto Yahoo Finance and looks at what the Stock Market did today, they are looking at the Nominal Dow. What most do not realize is that, in real terms, the stock market has collapsed in value since 2000. If instead of looking at the nominal Dow one were to look at the real Dow, priced in Gold, you would be seeing the Dow not at 12,000, but at a level below 200. No, that is not a typo. the Dow has made no net progress since 1926. In a recent interview, an excerpt of which can be found here, Robert Prechter talked about the stark difference between the Nominal Dow and the Real Dow, or even the Dow divided by the Producer Price Index. In other words, if you were to price the Dow in anything else other than U.S. Dollars, it would be much lower than it is today. The fact that Nominal Prices have held up over the past decade is a reflection not of the value of the Dow staying relatively constant, but of the value of the U.S. Dollar going down. The Nominal Dow can be viewed as:
Value of the Dow/ Value of the U.S. Dollar
Using simple math, one can see that, if you decrease the denominator (in this case the value of the U.S. Dollar) , it makes it it appear that the value of the Dow is up, since the value of the entire fraction increases, however it is really just the value of the measuring unit decreasing. This devaluation of the U.S. Dollar has been courtesy of the Federal Reserve and our Debt-Money System. Therefore, when the Debt-money system collapses, and the U.S. Dollar starts rising in a highly deflationary environment, which has already begun in 2006-2008, and should accelerate in coming months and years, the whole house of cards will come down, and the Nominal Dow will collapse in value, as it should have in 2000. But, these genius central planners have managed to hold up this debt Ponzi Scheme and thus nominal prices, but as Issac Newton stated: "what goes up must come down", and the global credit bubble is no exception.
The Dow Most people see:

The REAL Bear market in stocks:

Wednesday, February 29, 2012
U.S. Dollar set for takeoff
The U.S. Dollar is set to move higher. Depending upon whether or not THE top of the bear market rally that started in March 2009 has been seen, this move will either be moderate or explosive to the upside. If we are indeed topping now, which is a very real possibility, then the U.S. Dollar index should take out its 2009 high of 89.62 in short order, and the SPX its 2009 low of 667. Regardless of whether or not this is THE top of the bear market rally or whether we have one more move up coming after a pullback, the top is getting close and when it is put in, these parameters for both the U.S. Dollar and the SPX will apply.


Tuesday, February 21, 2012
DOW hits 13,000, Transports not confirming....and a financial freight train heading this way
The DOW crossed the all-important psychological barrier of 13,000 today. This is sure to get people even more bullish than they are now, which is already at euphoric levels. This juncture reminds me of mid-to late 2007, when the S&P 500 made a new all-time high, exceeding the peak of 2000 at 1553 by a mere 1.48 percent. Except this time, the market has not yet made a new all-time high and yet Bloomberg TV this afternoon features the headline "Hedge Fund managers gaga for Google." If that is not a contrarian indicator, I don't know what is. Meanwhile, we have a very important non-confirmation going on, and that is between the Dow Jones Industrial Average and the Dow Jones Transportation Average. Those familiar with Dow Theory understand that these non-confirmation, until and unless cured, are NOT to be taken lightly, and coupled with sentiment at optimistic extremes, and waning upside momentum, the top of the entire rally from March 2009 looks to be getting close. Also of note, Ralph Nelson Elliott, in his original writings, noted in "R.N. Elliott's Masterworks", projected the top of the Grand Supercycle Bull Market in 2012. Well, here we are in 2012 with the market still at extreme historical levels. This would allow the market to make another new all-time high before finally starting the big crash. But people should not be counting on that happening. When this market tops and turns down its going to catch a lot of people off guard. There is a freight train coming towards the financial system and it will stop for nothing. It is Imperative that people get out of the way before the train comes into town. And the more Ben and company meddle in the markets, the worse it is going to be. They have already thrown everything but the kitchen sink at the problem, and it has not solved ANYTHING. It has, however, helped to inflate these markets to unimaginable heights and the fallout from that will be MUCH worse than 2008. When this market tops out, it is going to get ugly fast. I am warning, Do not try to time the top, get out of dodge now and move to maximum safety. This means the safest possible cash equivalents in the safest possible institutions. This market is running on fumes and when the gas runs out its not going to be pretty.


Wednesday, February 15, 2012
A blowoff top in AAPL
Back in the late 1990's and early 2000's, when Steve Jobs, CEO of Apple, was brought back to the company after having been removed some years earlier, nobody believed in the company, and everybody knew why AAPL stock was not the thing to own. Of course in retrospect, it was a great buy. Well, now after Jobs turned the company around, everybody knows why AAPL IS the stock to own. As usual, the fundamentals are going to fool people into doing the wrong thing (buying Apple stock). AAPL has simply gone parabolic, and is in a fifth wave up from its 1997 low. As you can see, each rise (wave) slope has gotten steeper and steeper. This is not sustainable and AAPL is topping out on a long-term basis. Once the bear market in AAPL begins, as per the guidelines of Elliott Wave Principle that state that support after a 5 wave advance lies at the 4th wave low, my ultimate downside target for AAPL is AT LEAST the 2008 low at 78.20, and likely lower than that due to deflationary forces about to hit the markets. It is quite possible AAPL will do a "throwover" of the upper trendline of the wedge in a final burst up in a 5th wave of Primary wave 5, before reversing hard and heading back towards the fourth wave low.


Monday, February 13, 2012
Bear Market Rallies and B wave psychology
Bear Markets unfold in 3 waves. Most commonly labeled A-B-C. Whenever a supercycle is completed, a crash unfolds. This is the "A" wave of the bear market. It is usually a very sharp drop in a short amount of time (in this case, 17 months from October 2007-March 2009). Then, a B wave bear market rally unfolds, that serves to unwind the oscillators and relieve oversold conditions. This is often associated with a temporary recovery in economic activity. But perhaps the most important element here is the psychology of B wave bear market rallies. At the "A" wave low in March 2009, pessimism was dominant, with most thinking we were headed into deflation and economic depression and thoughts about the end of the world. A bear market counter-trend rally then unfolds, called a "B" wave, and serves to correct the decline that just unfolded. By the time a B wave is over, most economists and financial professionals are convinced that the worst is over and good times are back. Then, the final, and most devastating, portion of a supercycle bear market unfolds, the "C wave" that drops significantly below the "A wave" low. I believe we are facing something similar to 1929-1932, and this time period can be compared to April of 1930, at the top of the "B wave" during that bear market. Economists have credited the FED with saving the economy, and most investors are convinced that we are in a new bull market. This is the nature of B waves. They fool everyone into thinking the worst is over. The goal of bear markets is to make the most number of people lose the most amount of money, Bull and Bear alike. I would say that has certainly been true of this bear market, as the bulls took it on the chin in 2008, and the bears have all but given up trying to short as the market has gone higher and higher since March 2009. However, even amidst this tremendous 100%+ rally we have seen, it is still just a wave B bear market rally, with wave C still to come. This deflationary wave should be MUCH worse than 2008. Historical precedent for this type of move can be found in the 1929-1932 bear market, shown below:

As can be seen, the B wave bear market rally retraced part of the initial decline from the 1929 top. The C wave then carried the market down to MUCH lower lows, and by the time the bear market was over the market had lost 89% of its value. I believe we are in for a similar decline, and my target remains the same of below 800 on the DOW. The sentiment currently out there is certainly consistent with the top of a bear market rally, with some sentiment exceeding extremes seen at the all-time high in October 2007. Many who were calling it a bear market rally before have given up and turned bullish. The same thing happened by the top of the B wave in April 1930. The difference this time is that everything is bigger. The bubble is bigger, the upward retracement is bigger, and the lies are bigger. Ultimately, the decline should be bigger as well. This kind of environment is why it is important to NOT listen to the talking heads on CNBC and stay safe in the safest possible cash equivalents. The collapse of our debt-money system is dead ahead, and by the bottom the bear market nobody will even think about buying stocks, but of course that is the time when attractive valuations show up in the market and that is the time to buy. But its IMPERATIVE that people remain safe during this time. The C wave is out there, should be much worse than 2008, and likely worse in percentage terms than 1929-1932. This time everything has been magnified. The debt bubble is bigger, and the central planners have done even more to try to prop the system up. It will not work, and their efforts will only serve to make matters worse. I believe we are very close to the top of this B wave bear market rally. The C wave is next, and its NOT going to be pretty.


As can be seen, the B wave bear market rally retraced part of the initial decline from the 1929 top. The C wave then carried the market down to MUCH lower lows, and by the time the bear market was over the market had lost 89% of its value. I believe we are in for a similar decline, and my target remains the same of below 800 on the DOW. The sentiment currently out there is certainly consistent with the top of a bear market rally, with some sentiment exceeding extremes seen at the all-time high in October 2007. Many who were calling it a bear market rally before have given up and turned bullish. The same thing happened by the top of the B wave in April 1930. The difference this time is that everything is bigger. The bubble is bigger, the upward retracement is bigger, and the lies are bigger. Ultimately, the decline should be bigger as well. This kind of environment is why it is important to NOT listen to the talking heads on CNBC and stay safe in the safest possible cash equivalents. The collapse of our debt-money system is dead ahead, and by the bottom the bear market nobody will even think about buying stocks, but of course that is the time when attractive valuations show up in the market and that is the time to buy. But its IMPERATIVE that people remain safe during this time. The C wave is out there, should be much worse than 2008, and likely worse in percentage terms than 1929-1932. This time everything has been magnified. The debt bubble is bigger, and the central planners have done even more to try to prop the system up. It will not work, and their efforts will only serve to make matters worse. I believe we are very close to the top of this B wave bear market rally. The C wave is next, and its NOT going to be pretty.

Thursday, February 9, 2012
Risk and Return way out of balance....
In modern Finance, one is supposed to be compensated for risk. The higher risk one takes, the higher return should be generated...this has been historically true, but certainly not today with one investment. That is the investment of loaning the bank your money. Interest Rates are near zero, and the risk of loaning the bank your money is IMMENSE. Interest rates would have to be much, much higher to justify the current level of risk in the system. One might say, "But I don't loan the bank my money, I deposit it." But that assumption is false. Whenever anyone makes a deposit at the bank, because of our debt-money system, it is a loan which the bank in turn leverages hundreds of times over and lends out, or, in recent history, gambling it and additional free money from the FED in derivatives markets. Despite what all the pundits and "financial gurus" say, the banks are NOT a safe place to keep your money, and the FDIC will NOT be able to handle the coming system-wide banking collapse.The FDIC can handle so many banks at once, but certainly not the whole system at once...and to that point the collapse of the global banking system should be quite swift. As the onset of the depression draws near, people need to act now. DO NOT listen to the Media, telling you this is a "recovery". It is not. It was a temporary respite from an ongoing depression, and a depression that is about to make itself known in a big way. As soon the the bear market rally in risk assets ends, the real collapse starts. That is why people have to take action NOW. This does NOT MEAN keeping your money in Gold and Silver as "safe havens", they are risk assets as well and will be sold to generate cash to pay off the massive amount of debt worldwide. The Dollar will rally as the global banking system collapses. This means either opening a Swiss Bank Account for those with large sums of money, or, for most, opening up an account with treasurydirect.gov and buying short-term t-bills only, as well as keeping physical greenback cash on hand. This is one of the last chances to preserve capital...time is running out fast.
A classic Breakdown and Backtest of trendline resistance
In Technical Analysis, whenever support is broken, it is usually backtested. With all the hype of a "new bull market", from a technical point of view the entire rally from 2009 has served its purpose: to backtest long-term resistance. The market broke cleanly below this trendline in 2008 and is simply backtesting it. Isn't it hard to believe? Talk of a "new normal", and "double dip, no double dip" is all very, very wrong. This is the wrong mindset. We are in a slowly developing depression, that has been developing since 2000. We have been edging towards the end of the cliff, and are about to fall off it. A breach of the March 2009 lows should be in short order, once we get the proper cyclical setup as identified by Tim Wood.

Now notice the same chart up close on a daily timeframe, and how close the DOW is to its long-term resistance line:


Now notice the same chart up close on a daily timeframe, and how close the DOW is to its long-term resistance line:

Thursday, January 19, 2012
Huge Bull Trap Setting up
While the major indexes are closing in on their 52-week highs.... and are likely to exceed them as we await this cyclical setup identified by Tim Wood as occurring at EVERY major top since 1896...the bears are all but disappearing. The following chart by Sentimentrader shows how few bears there are left.


Meanwhile, as I have stated before, Tim Wood's cyclical DNA marker setup will mark the top of this bear market rally that started in March 2009. Despite all the bulls that are coming out saying its a new bull market....its still just a bear market rally that will serve to trap the bulls in that buy on a "breakout". the Nasdaq 100 index (NDX) has broken out to a new 52-week high today, and the other indexes are likely to follow shortly....but once we get this setup....its game over. I do not see the S&P getting much higher than 1440-1462. One thing I can say with certainty is the higher this bear market rally goes, the more people it is going to fool.....and the more pain will ultimately be felt as the next leg of this bear market takes hold and deflation collapses asset prices. If people think 2008 was something....this next leg of the bear market is going to make 2008 look like a Sunday School Picnic.

Monday, January 9, 2012
Very exciting Juncture in the U.S. Dollar
I have maintained a solidly bullish long-term stance on the U.S. Dollar on this blog since its inception (first post on U.S. Dollar in November 2009). However, I thought there was a chance the U.S. Dollar index could take out its 70.70 March 2008 low before starting its massive Bull Market. Very Recently, Objective Elliott Wave (OEW) developed by Tony Caldaro has confirmed a long-term uptrend in the U.S. Dollar. This suggests the Dollar bottomed in 2008 and has been basing since. This is the original stance I took, however I started to entertain the idea that the U.S. Dollar needed another all-time low first. However, with the OEW long-term uptrend confirmation in the USD and long-term downtrend confirmation in the EUR/USD currency pair, the odds now shift to that the Dollar bottomed in 2008. Tony expects the U.S. Dollar index to reach 140 by 2018.....I expect much higher than that...possibly to 300 or higher. However, it will likely continue to base until the Gold market tops out in 2013-2014. In my view, this is all a topping process. With the bearish expanding wedge pattern developing in the DOW going back to the late 1990's, the foreign currencies topping out in 2012, the USD cycles bottoming in 2012, and commodities due to top out completely by 2014. It seems as if Deflation is about to come back with a vengeance. The safest place to be is cash as I have reiterated many times before...and with all these cyclical events happening.....people need to act now to get liquid and stay that way until the deflationary storm is over.

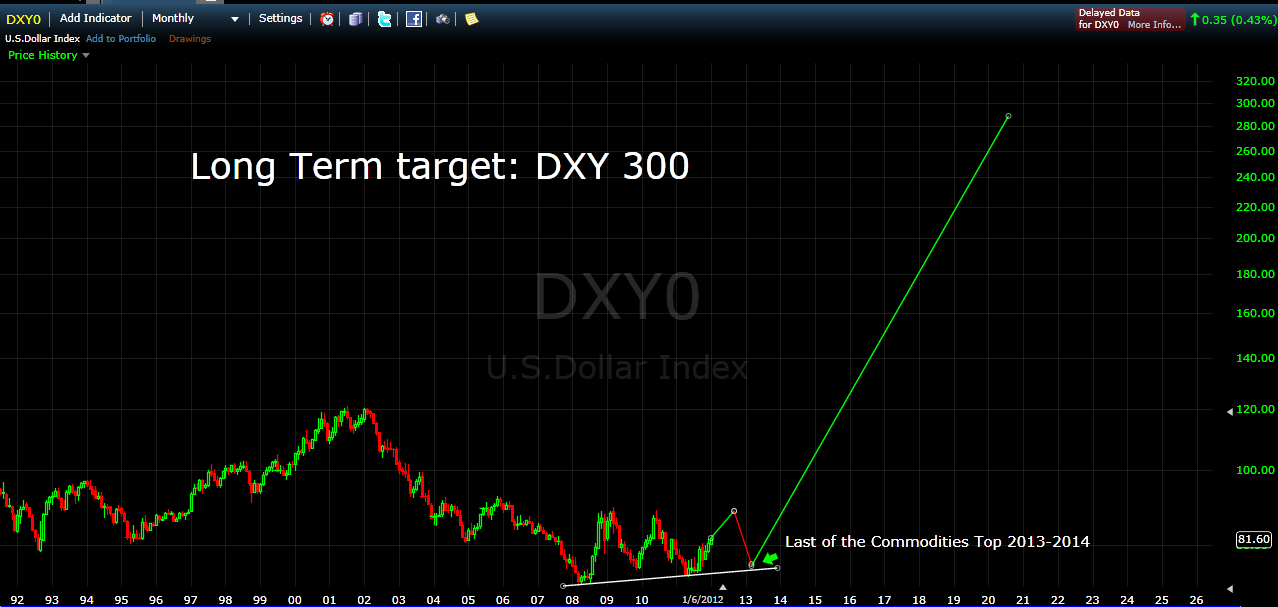
Just as an FYI: this chart IS drawn to scale....yes I expect the DXY to hit 300 before the end of the decade.
Thursday, January 5, 2012
Gold Silver and Commodities are NOT crisis hedges
Many analysts on Wall Street take Gold, Silver and commodities to be hedges against financial turmoil. The reality is that they are just assets that are sold to generate cash in economic contractions. Additionally, the entire time that Gold and Silver have been in bull markets since 2001, the stock market has held up and, in my view, been in a gigantic topping process. When this topping process ends, and the real financial collapse happens, which I believe is very soon, all of these markets should collapse with it. Gold and Silver will likely initially be viewed as hedges, and will likely be the last markets to top. But in the worst portion of the deflation, they will top out and collapse along with everything else as the 80-year credit bubble comes unwound along with the debt-money system. Dollars are is scarce supply and will be in great demand as the credit system collapses. Here is a great clip by Robert Prechter in which he illustrates how Gold and Silver go DOWN in bad economic times, not up.These markets may have a little more upside left, and the Dollar a little more downside, but 2012 is going to be a MAJOR bottom for the U.S. Dollar. I expect the USD to soar as the financial environment gets worse, as the margin calls come in and the USD shortage takes hold. The key to the end of this bear market rally, and ultimately I believe a decade long topping process, will be the appearance of certain cyclical DNA markers that have occurred at EVERY major top since 1896, discovered by Tim Wood. Once we get this setup, financial hell will break loose, and the U.S. Dollar should launch its greatest bull market of all time.


Subscribe to:
Posts (Atom)