Friday, December 30, 2011

And the Numbers are in....Happy New Year

Well, the numbers are in the for year. Today was the last trading day of the year and here is how everything worked out:


Which Asset won this year? That's right. U.S. Treasuries. Even with ALL the fear mongering by the media and the S&P Downgrade of U.S. Debt, the yield on the 10-year collapsed to a new all-time low. And as we know from 2007-2008, falling rates are NOT bullish. I think the drop in yields this year is a harbinger of things to come next year, keyword DEFLATION. Indeed, 2012 is setting up to be one for the record books and likely financial hell will come upon us because of the recklessness of people like Mr. Sarkozy, Mr. Obama, Mr. Bernanke, Trichet, Geithner, and all the other clowns in Washington and at the FED. Oh, and of course you can't forget our friends at Bank of America, J.P. Morgan Chase, and Goldman Sachs. Nice going guys, you have assured financial destruction around the world because of your recklessness, irresponsibility, and outright fraud. In the end, the music will stop and these crooks will get what is coming to them. But to everyone else, I wish a happy and healthy New Year. May 2012 bring you success and prosperity.

Wednesday, December 7, 2011

Bill Still responds to Republican Presidential Debate

All of these politicians are concentrating on the wrong things. The only politician out there that I know of that actually gets it is Congressman Dennis Kucinich of Ohio. Some other politicians have some of the right ideas but nobody is concentrating on the real problem: the Debt Money System, and until this fundamental issue is addressed none of the other solutions will work. The FED and their cronies are just providing a smoke screen for the American people to make us THINK the FED is in control of our money supply when it is really the big commercial banks that have a complete stranglehold on this economy.

Wednesday, November 23, 2011

Bill Still reporting from Occupy Wall Street in New York City

The road to serfdom this world is currently traveling.....private unelectable bankers rather than elected officials by the people and for the people. There IS something we can do about this. Bill Still for President.

www.still2012.com

Wednesday, November 9, 2011

Bill Still's Presidential Bid

Bill Still, writer/director and monetary reformist, has announced his bid for the libertarian nomination. Please support him and spread the message. Bill Still is our only hope from escaping the choke hold of the debt money system that is strangling the global economy to death. There ARE long term solutions to this economy, but no politicians or economists are talking about it. This solution is monetary reform. A few simple reforms can fix the fundamental problem: Debt. All of the crony  politicians  in Washington and corrupt bankers are the problem. Bill Still is the solution.

http://still2012.com/


Monday, October 31, 2011

Tim Wood

I would like to introduce Tim Wood. Mr. Wood is owner and operator of www.cyclesman.net. He conducts market analysis using Dow Theory and cycles. Tim has an excellent track record with calling major tops, most notably 2000 and 2007. He was warning people in 2006/2007 that this was not a new secular Bull Market and the 4-year cycle (a common cycle found in the stock market) was being stretched. This proved to be correct as the market had its most devastating decline since the 1929-1932 Collapse. Recently, a "Dow Theory Sell Signal" was triggered but Tim was warning not to be fooled as not all Dow Theory Signals are the beginning of a major move in equity prices. He has identified DNA markers that have been seen at every major top since 1896, which did not occur in conjunction with the May 2 top. I would say Tim Wood has been proven correct once again in recent weeks, as the market has has had quite rally. It is this next top that Mr. Wood thinks will be the real deal. I agree. Whether or not the market makes it back to 1370 on the S&P 500 is immaterial. The bottom line is that there is a major top coming in the market, that will serve to fool both Bulls and Bears. The Bulls will be claiming victory if the market rallies much further while the Bears will have given up. This is what the market does. It fools the greatest number of participants possible. I agree with Mr. Wood that it will be this next top in the market that will mark THE top of the entire bear market rally from March 2009. When the bear market really gets underway I also think it will make 2008 look like a sunday school picnic. Tim Wood was warning in 2007, and he is warning again. So am I. The return of the bear market is out there, and its not going to be pretty.

Tim Wood's website: www.cyclesman.net

Wednesday, October 26, 2011

Douglass Lodmell Interviews Robert Prechter

I would like to introduce Douglass Lodmell. Mr. Lodmell is an Asset Protection Attorney based out of Florida. His clientele include high net worth individuals who wish to protect their assets in the case of a lawsuit. However, with the precarious times we find ourselves in, Douglass Lodmell is worried not only about losing one's assets in a lawsuit, he is worried about those assets losing value. Accordingly, his number one goal is safety for his clients. Robert Prechter is the President and CEO of Elliott Wave International, a market forecasting firm based out of Gainesville, GA. Similar to Douglass Lodmell, Robert Prechter is advocating nothing but the safest instruments possible at this moment in time. Below is an interview that Douglass Lodmell recently did with Robert Prechter. It offers some very insightful information that one surely won't find in the mainstream media. For best viewing quality, scroll down to the lower right hand corner of the video and select "watch on youtube" and then select 720p and full screen.

Thursday, October 13, 2011

Capital Preservation

As I have stressed for some time on this blog Capital Preservation in this environment is key. I wanted to post tonight because this is one of the last chances people are going to have to preserve capital. People should be using the market rally now to raise cash. Do NOT listen to these inflation biased analysts who are saying hyperinflation is coming because Ben Bernanke will just start up the printing press when a crisis hits. Inflationists do NOT understand the nature of our money. The reality is that the biggest margin call in history is about to beset us...and one of the only things that will be going up in value is what has been inflated into oblivion for the past 100 years: The U.S. Dollar. I am extremely bullish on the U.S. Dollar as I have illustrated before and if it has not made its bottom already it is close. The reason for the coming U.S. Dollar Bull Market is a shortage of Dollars, the opposite of what most think. Most people think there is a shortage of commodities and an overabundance of U.S. Dollars, when in fact it is the exact opposite. The reality is that there is virtually NO money in the system....just promises to pay money, courtesy of the banks. The private banking cartel is in complete control of our money supply and all but one ten-thousandth (that's right, 1/10,000) of our money is debt. That little bit of money that is actual money consists of coins minted by the U.S. Treasury, as debt-free government issued money. All other money in the system is created as a LOAN; an interest-bearing debt...for which the interest cannot be paid. This will result in a credit implosion the likes of which we have never seen. This debt contraction creates an increased demand for dollars to satisfy debts, all the while the supply of dollars is diminishing due to contracting credit...this all has VERY Bullish implications for the U.S. Dollar...and very BEARISH implications for all dollar denominated assets....including Gold and Silver. In Elliott Wave terms, the world currencies are putting in supercycle tops...while the U.S. Dollar is putting in a supercycle bottom. From a cyclical standpoint, there are long-term cycles that are reversing now or in the near future...get ready for fireworks. The way to do that is to first get your money out of the big banks...they will fail in this next phase of the global credit crisis. This is already happening in Europe and will make its way around the world until there is virtually no credit left in the system...that is a long way down. The main point I want to stress, however, is that there is no reason anybody should be hurt by this credit implosion. Those who keep their wealth safe in the safest possible cash equivalents in the safest possible institutions and with the safest governments will come out the other end with all their wealth intact. Please read Bob Prechter's 2002 Book, "Conquer the Crash: you can survive and prosper in a deflationary depression" and see the second half for how to keep your money safe. A safe alternative is opening an account with www.treasurydirect.gov and buying short-term only t-bills directly from the treasury. Time is running out and it appears as though the music is about to stop in this game of musical chairs....and as usual the most underprivileged will get hurt the most. But as we are seeing with the "Occupy Wall Street" rallies, people are catching on, and they are NOT happy campers. Social mood is worsening and will get much worse before the final bottom...which is why it is important to stay ahead of the curve and prepare for the collapse before it happens.

Friday, October 7, 2011

State Of The Markets

This market has had quite a decline since the May 2 high- 21.58%. That was enough to get CNBC to call it a "bear market"- as they define a bear market as any decline over 20%. So what happened? As usual when CNBC makes a call the market does the opposite. They weren't talking about a "bear market" with the SPX at 1370 in May. They were talking about the "good news" that Osama Bin Laden had been captured. Now they are negative because the market declined 20%, so the market did what it usually does when CNBC gets bearish: Reverse hard to the upside. The market formed an Ending Diagonal into the SPX 1074.77 low and staged a major reversal to the upside- as ending diagonals are supposed to, with a "throw-over" of the lower trendline, as illustrated below.


Now that the market has staged a major rally, the question is, what's next? I have plotted some Fibonacci resistance levels that should provide resistance. If this rally is corrective in nature, then it is most likely wave 2 up of the next major leg of this Bear Market. However, if the market starts impulsing to the upside. Then this market is set to take out the 1370 highs of May 2011. As I have emphasized before, however, it doesn't matter so much whether the rally is over or not. It matter that people get positioned for the long run trend of this market, which is DOWN. That means finding the safest possible cash equivalents and staying OUT of ALL traditional investments- Yes that includes Gold and Silver...This Bear Market could very well trump the 1929-1932 collapse...because the situation is much bigger this time....not to mention the fraud is on a MUCH more massive, scale....around the world.

Thursday, September 29, 2011

Bill Still's latest video blog

Let me make myself clear...time is running SHORT......unless every state enacts legislation to create their own state-owned bank....the entire system will become engulfed in its own debt and become insolvent rather quickly....crises build up for years, and resolve themselves faster than people can adjust...which is why it is absolutely imperative that people act NOW to protect their wealth. I recommend reading Robert Prechter's book "Conquer the Crash: You can Survive and Prosper in a Deflationary Depression" for ways to preserve capital....the key here is not the return on your money...it is the return of your money.


Monday, August 8, 2011

Brazilian Bovespa Double Top.....looks extremely negative long term

The Brazilian Bovespa Index has risen from a low of 23.70 in April 1993 to 73,920.30 in May 2008. It has now rallied up basically to that high and formed a double top...the implications of such a formation are extremely negative....considering the magnitude of the rise from April 1993.


In addition, The index has negative divergence on a quarterly chart.. further adding evidence that long term top is in place. I expect this index along with all the other commodity driven indexes and currencies to decline for many years while the biggest margin call in history comes due and the U.S. Dollar takes off in a Bull Market...while commodities and almost every U.S. Dollar denominated asset decline in bear markets.


Thursday, August 4, 2011

A brief review of bear market targets

The action in the market today helped solidify the case that the bear market rally is over and the bear market that began in 2007 has resumed. Whether or not this was the actual top to this bear market rally I think is immaterial. What is important is that people keep their wealth intact by getting out of all traditional investments, so that when the final bottom does come, people will have the money to capitalize on it. That being said, I want to briefly go over my target levels for the bear market low. My first target (which could very well be the bottom, let's hope it is) is below 800, and ideally at DOW 770, the 1982 low. If that fails to hold the next target would be the 1974 bear market low at DOW 570. If that fails we are likely looking at a move below 400. The target range there would be 40-386, the range of the 1929-1932 bear market. Whichever of these levels the DOW finds support at, I expect it to be undercut slightly in a capitulatory move to the final low before a new Bull Market begins. As I have stated before Banks are going to ZERO and I am sticking with that target.


The Stock Market almost made a new bear market low...in Real terms

The "real dow", which almost nobody talks about, and which was crashing even as nominal values were going up in 2003-2007, has just about made a new bear market low today, at 6.89 ounces of Gold. Compaire this to over 40 ounces of Gold in 1999. I expect this ratio to go to 1 or lower. This means Gold will be worth as much, if not more, than the DOW at the bear market low. I expect this to be between 400-1000. It is going to be a long way down, even in nominal terms.


Wednesday, July 27, 2011

Thursday, July 21, 2011

A Potential Grand Supercycle Bear Market

Looking at the very long term charts, it appears the western world has completed an economic expansion dating back more than 200 years, to the time the United States was founded in 1776. In Elliott Wave analysis, whenever 5 waves up are completed, there is a correction. The size of the correction is usually proportionate to the size of the uptrend that has completed. If we have indeed completed a structure dating back to the bursting of the south sea bubble in 1720 (with the proceeding Grand Super cycle Bull Market starting in 1784), then westerns markets will lose virtually all of their value. If the DOW were to follow a textbook pattern, it would fall to 40. That is not a misprint. That is, however, a decline of 99.7% and would represent the biggest bear market in 200 years as the credit bubble deflates. This is the worst case scenario  for now (there are other scenarios of wave structure that I will not go into) and would represent a complete retracement of all the credit inflation since the 1932 bottom. The bear market in this case would last approximately 100 years, although I expect the actual nominal price low to come very early into it (circa 2016).


U.S. Dollar starting a trip to a bear market low

The U.S. Dollar appears ready to resume its long term downtrend targeting in the mid to upper 60's on the U.S. Dollar Index. This should be the last downtrend into a bear market low.....after which it should launch a massive Bull Market lasting much of the decade. Meanwhile the DOW is embarking on what should be its final uptrend to a top for this bear market rally.

Tuesday, July 5, 2011

Our Debt Money System and an introduction to Bill Still

Bill Still, a writer/director and monetary reformist, produced a film in 1995 called "The Money Masters" in which he explains the history of banking and the problems we face today. More recently, Bill directed a film called "The Secret of OZ", which uncovers the secret hidden monetary message in L. Frank Baum's original work "The Wizard of OZ". If asked about who controls the quantity of money in our economy today, the vast majority of people would say the government, or that the Federal Reserve controls it but is a government agency. The reality of the situation is that the Federal Reserve is neither Federal nor a Reserve, is NOT part of the government but rather privately owned by member banks, and is a complete deception altogether. When the Federal Reserve act was passed in December of 1913, Congress was not in its normal session but rather on break for the holidays. Immeditately after it was passed the President of the United States admitted it was a mistake, and yet, nearly 100 years later, it is still here, manipulating our economy and fooling the public into thinking it is promoting economic growth. Every Dollar in circulation today, under the current system, is created as an interest-bearing debt. One of the many problems with this debt money system, and perhaps the most important one,  is that the interest can never be paid off. Every time a Dollar is created as bank credit, it is comes with interest that must be repaid with the principle. Let's call the Principle "P", and the principle plus interest "P+ I". Each time a deposit enters the banking system, banks are able, under the current fractional reserve lending system, to loan out many times that amount in bank credit, which is money created by banks out of thin air simply by entering key strokes on a computer.  A great illustration of this process can be found by watching "Money as Debt", which can be found in full on Google Video Here. The banks expect to be paid back P+I, but the problem is that only the "P" was created in the first place. In order to pay back the interest, new principle must be created. However that also comes with interest, so it becomes a vicious never ending cycle of debt creation. If this process of creating new to satisfy the old sounds familiar to you, it is because our monetary system today is very similar in nature to what Mr. Bernard Madoff committed, a Ponzi Scheme. The only differences being, this one is legal and on just a "little" bigger scale. For an introduction to Bill Still, please watch the video below:


Here is his latest movie The Secret of OZ:


and Here is his original film, "The Money Masters" (highly recommended)


In April 2011, I hosted Bill Still at my School to give a presentation to interested students and faculty. Here is the introductory speech I gave:


Hello everyone. First I would like to thank you all of you for coming this evening. My name is Chris Wallace and I am currently a junior at Bryant studying Finance. I first came across Bill Still’s work when a friend suggested I watch “The money masters”. Bill Still directed the money masters back in 1995. In it, he explains in detail the history of the United States monetary system. He illustrates how the banking cartel and the Federal Reserve helped private bankers regain control over our money supply and set the stage for the fraudulent monetary system we have today. Mr. Still predicted the economic crisis that continues to unfold before us. He described why this debt money system was doomed to plunge the country into an economic crisis that would not end until we addressed the fundamental issue at hand: Not what backs our money, but who controls its quantity. He explains that the only way out of this situation is to restore monetary power back to the people through their elected representatives in congress. Now let’s fast-forward to today. The world economy is suffering from the deepest economic downturn since the great depression. Many are talking about the “recovery” that began in June 2009. But what has changed? All that has happened is the authorities have thrown more money at the problem to try to sustain our unsustainable debt ponzi scheme. We are in a depression, and it’s not going to get any better until we address the fundamental problem at hand. The good news is, with enough help and support; we can do something about it.  I have invited Bill Still here today because I have hope that people will latch on to these essential principles of sovereignty to explain what needs to be fought for and the ways in which we as a sovereign nation can do it. With enough support, we can fight to put an end to this debt money system and finally free ourselves from the debt shackles that currently enslave us and put authority to create money back in the hands of the sovereign nation; by the people and for the people. Ladies and Gentlemen, Please help me in welcoming Bill Still.

Tuesday, June 21, 2011

Shortage of Commodities? er...ummmm....shortage of U.S. Dollars? MAJOR U.S. Dollar Bull Market setting up

Many people are talking about a shortage of commodities and peak oil and how that will send commodity prices to the moon. These same people are also talking about all the "Money Printing" that is going on, causing an abundance of U.S. Dollars (and other fiat currencies) and how that will also send prices skyrocketing. In my view, the situation is EXACTLY the opposite. There is actually a massive shortage of U.S. Dollars, due to the fact that there is large sea of unpayable debt in the global monetary system. This debt is denominated in fiat currencies, but there is more U.S. Dollar denominated debt than any other currency in the world. Creditors want to be paid in U.S. Dollars, not Gold or Silver or other commodities. So essentially there is not enough money in the world, and too much debt. Debt satisfaction creates a demand for the currency it is denomninated in, while at the same time all the contracting debt is diminishing the supply of U.S. Dollars. So there are two forces at work here

1. An increase in demand for Dollars to satisfy debt payments

2. A MASSIVE reduction in the supply of available Dollars due to debt contraction that can collapse much faster than the Fed can counter it.


This money dynamic is extremely Bullish for the U.S. Dollar going forward. As  the world's debt money system collapses, deflation will take hold and send the value of the U.S. Dollar skyrocketing, and the value of U.S. Dollar denominated assets to virtually ZERO. This does sounds extreme, but what has already occurred since the inception of the Federal Reserve since 1913 is the real extreme that most people don't even take notice to. It is the Massive inflation of our money supply through Credit Inflation. the crash will correct this extreme.  In addition, Since most all of our money is debt (with the exception of coins, which make up about 5% of the money supply), for the Federal Government to "Pay off the debt" would be to contract the money supply and cause a depression. Since an ultimate default by the U.S. Government is virtually inevitable (unless they decide to print their way out of it, which they are not likely to do until after the collapse happens, using 1929-1932 as an historical precedent), a massive contraction in our money supply is also inevitable. This has already begun in 2008, and is the first contraction in the money supply since the 1930's. The difference this time is, the bubble leading up to the 2007 top is much bigger than the one leading up to the 1929-1932 crash. This means we should expect a decline greater than 1929-1932. DOW 570 would equate to a 96% decline, greater than the 89% decline of 1929-1932. While all this happens, the U.S. Dollar will be in a Super Bull Market as credit contracts and the few dollars that are left in the system will be scrambled for by debtors. The U.S. Dollar does not appear to be finished with its bear market, however, contrary to what I previously thought. While it could just take off from here, it is likely to get down to the mid-to upper 60's on the U.S. Dollar index, fool everyone into this Dollar Collapse Scam, and then take off in a Super Bull Market. This should last until the debt collapse is over, most likely 2020-2023, although the chances are high for a final low in the stock market in 2016 or 2017.

Market Update

As it turns out, the stock market did move on to new highs, but only in three waves, not five. That could have marked a weak end to the bear market rally, or the other option is that the market has been corrective mode for most of 2011. It is possible that the market is in an expanded flat correction from the 1344 high in Feburary 2011. Under this scenario, the market should ideally retest the SPX 1249 low, although it is not required in this type of correction. If this is the case, then the bear market rally will continue after this correction is over, and likely top in early to mid 2012.


As Bob Prechter points out, the only thing holding up the market is the 7.25-year cycle and the Federal Reserve's accommodation to speculators by adding reserves to the banking system  through the purchasing of treasury bills that has allowed banks to speculate in markets rather than lend the money out. This has been the driving force behind the recent rise in commodities and other inflationary assets (including stocks). However, in my view, when this cycle tops out, and investor psychology turns negative again, the Fed will not be able to stop the decline in what I belive is the worst portion of the bear market yet to come. They will pull all sorts of tricks out of the hat, but the coming collapse in credit will be too fast and too strong for them to handle. The FDIC may even have a hard time honoring all the claims from patrons of failing banks. Whether or not this bear market rally is over, it is still a bear market rally, and it is very important that people understand the risks inherent in this market and stay CLEAR of all traditional investments and get positioned in the safest possible cash equivalents. This includes Short-term t-bills (anywhere from 1-month to1 year), swiss money market claims, as well as physical cash. I believe the U.S. Dollar is at the very end of its bear market that has lasted so long, and will go through a massive short-squeeze where debtors are being forced to liquidiate assets to pay off their debt. As the U.S. Dollar gets stronger, it will be harder and harder for debtors to maintain their position, and will either have to pay their debt off, default or restructure. The size of the credit bubble that is bursting is the biggest in human history. This financial debacle we are in is one for the record books and has highly deflationary implications. As I have stated int the past, my target for the final low of this bear market is below 800 on the DOW, and most likely below 570, the 1974 low. The Social implications of this are extremely negative as well, and since this is a much bigger bear market than the one that ended in 1974, the social unrest should be that much worse. We are already seeing this manifest around the world, especially in the middle eastern countries (such as Bahrain and Libya), and Greece, where leaders are being overthrown because Social Mood is decidedly negative. This is all implied by Robert Prechter's Socionomic Theory of Finance. The Following is a great presentation done by Prechter on Socionomics. The link includes parts one and two. To view parts 3 and 4, you will need to register for free using the link at the bottom of the page.
http://www.socionomics.net/socionomics-a-new-perspective-on-social-causality-parts-1-and-2/

Thursday, February 10, 2011

Major dollar rally setting up

The Dollar has had a nice move up from November 2010 when all the media was talking about was hyperinflation. Well, it seems that psychology has not changed. People are still ultra-bullish on stocks at their highest levels since June of 2008, commodities at their highest levels since the beginning of October 2008, while  calling death to the U.S. Dollar and bonds. It is in this type of extreme sentiment environment that markets reverse. The Dollar may need a little more downside to wash out the few bulls that remain in that market, but I suspect the Dollar is set to commence on a major rally. This would be supportive of a decline in all of these liquidity driven markets for at least a period of time, and possibly something more serious. Also of note, Emerging Market fund outflows are at their highest levels since 2008. Before the crash of 2008, emerging markets topped a few months after U.S. stocks did. It is possible, under the bearish scenario I laid out in my last post, "Market Update", that this time emerging markets are leading the way down. Under the bullish scenario, this would just be a 15-20% correction in Emerging markets. Nevertheless, all of these markets are being driven by liquidity right now, in what Elliott Wave International calls "All the Same Market". When liquidity is expanding, stocks, commodities and other inflationary assets are pushed up, and when liquidity contracts, markets all go down together, as we saw in the second half of 2008. I strongly maintain that the bear market is NOT over, and probably has about 6 years to go. Again, the action over the next few months should provide clarification as to whether this bear market rally is going to continue for a while, or whether it is ending now. We'll let the market decide that. Below is a longer term analysis of the U.S. Dollar. the same dynamics of liquidity apply to the U.S. Dollar, except in reverse. As liquidity expands, people become more optimistic and selling dollars to buy inflationary assets, and as liquidity contracts, people become more fearful and liquidate inflationary assets to raise cash.


Longer term, the U.S. Dollar is forming a large triangle on a weekly chart. Triangles are consolidation patterns, and in this case I believe a basing pattern for a new Bull Market in the U.S. Dollar. This next uptrend in the U.S. Dollar will be key. If the uptrend breaks strongly through the upper trend line, it would suggest the Dollar has been basing since March 2008 and has already started its Bull Market. If the uptrend is corrective and weak, that would suggest the Dollar will make one more minor new low below its March 2008 low of 70.70. In my last post, regarding the stock market, I also mentioned that this next downtrend in the stock market will be key as well. The nature and extent of the next rally in the Dollar and bonds and decline in the stock market (which should all occur simultaneously) should provide clarification to the next major move for stocks commodities and other inflation assets. My expectation of a coming significant intermediate term dollar rally  is consistent with my expectation with AT LEAST a correction in all of these liquidity driven markets.

Wednesday, January 19, 2011

Market Update

On March 6, 2009, The S&P 500 stood at a 12-year low at 666.79, with only 2% of traders bullish on the stock market. That means 98% of traders thought the market was going lower. Yet, amidst the worst recession since the great depression, with no positive fundamentals, the market started a rally that has progressed over 94% from the low to yesterday's high of 1,296.06. Now there are over 90% of traders bullish on the S&P, with an positive fundamentals, and improving economy, and, needless to say, optimism. While the stock market has risen over 90%, and most are convinced a new secular bull market started at the March 2009 low, it is still only a bear market rally within a much longer term secular bear market. The aim of bear market rallies is to convince everybody that the bear market is over. Once that happens, and enough people are convinced that a new secular bull market has started, the market reverses and the bear market resumes. There are a number of reasons I am convinced this is only a bear market rally. One is valuation measures. Whether you look at dividends, P/E ratios, or the percentage of mutual fund cash (currently at an all time record low) the market is historically over valued. In early March 2009, the P/E on the market was 23.77. This is not a reading that has coincided with previous bear market lows. In the 1932, the P/E ratio got down to 10. In 1974, the P/E ratio was 7.24, and in 1982, even with a higher low in the market, the P/E was an even better 6.9. The current P/E ratio, according to http://www.multpl.com, is 23.47. When the market makes its final low for this bear market, I expect the P/E ratio to be within the range of normal bear market lows, and possibly even lower. In other words, I think there is a great buying opportunity coming up this decade, however I do not see that time as now. Another reason I think the bear market is not over is secular cycles. The stock market moves in waves of optimism and pessimism. When the market is moving in a long-term uptrend, and optimism is building, we call that a bull market, and when the market is moving in a long-term downtrend, and pessimism is building, we call that a bear market. There are two types of bull and bear markets: Cyclical and Secular. Cyclical bull and bear markets are usually multi-month or multi-year uptrends or downtrends, however they are within the context of secular bull and bear markets, and usually fool the public into thinking the long term trend has changed. For example, the crash of 1987 was a cyclical bear market, but it was in the context of the secular bull market that started in 1982. That secular bull market ended in 2000, and lasted about 18 years, although the nominal Dow did not top out in Primary Wave V (the last wave of a bull market) until 2007. Even though the stock market made a new high in 2007, it did not in real terms, as I have shown in previous posts. So while a cyclical bull market unfolded between 2002-2007, the secular bear market actually began in 2000. Before that bull market started, we were in a secular bear market from 1966-1982, 16 years, before that a secular bull market from 1949-1966, 16 years. See a pattern? Based upon various time cycles and historical bull/bear market relationships, I am expecting the stock market to make its bear market low on or close to 2016. The year 2016 would mark 16 years since the bear market began in 2000. Within the secular bear market that lasted from 1966 until 1982, there were cyclical bull markets, but they were all in the context of a long term secular bear market until the market made its final low in 1974 at Dow 570. That brings us to today, Wednesday, January 19, 2011. The market has risen from March 2009 in a bear market rally (cyclical bull market). The sentiment on Wall Street right now, in my opinion, is the complete reverse of early March 2009. This market is in for AT LEAST a correction, if not an end to the entire bear market rally. Tom Demark, a well-respected market technician on Wall Street, issued a sell signal tonight, one that has not been issued since July of 2007, saying

" U.S. stocks are within a week of “a significant market top” that is likely to 
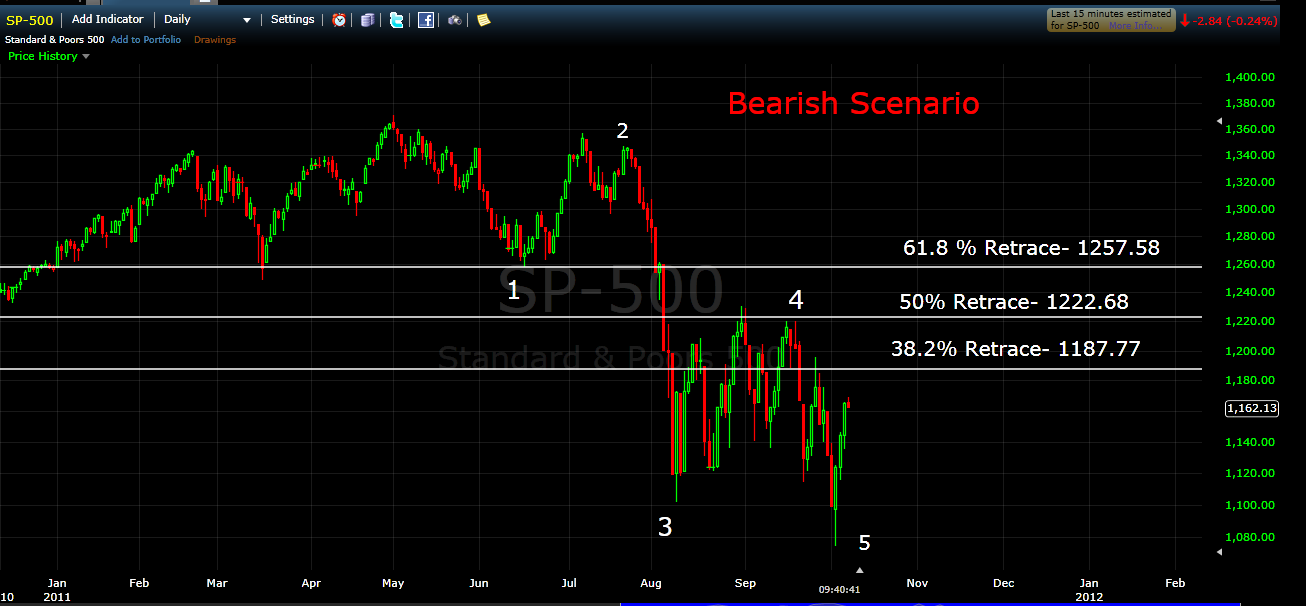
precede a drop of at least 11 percent in the Standard & Poor’s 500 Index. “I’m pretty confident that in one to two weeks, the market will be in a descent,” said DeMark, founder and chief executive officer of Market Studies LLC. “It could be pretty sharp.” His words of warning are certainly justified, as the market is completing 5 waves up from July 2010, and is close to starting a new downtrend. Below are some charts I have put together. In Elliott Wave, whenever you complete five waves up, you have a 3 wave correction, as shown below. The chart below is the bullish scenario, that this is just a pullback within the ongoing bear market rally, and Wave C up will subdivide into 5 waves, with the move from July 2010 being wave one. After this we would get an A-B-C pullback in a wave 2, then waves 3, 4 and 5 to complete wave C and in turn the bear market rally.


The following chart implies that the entire bear market rally is ending now, completing a 3 wave move (A up into April 2010, B down into July 2010, and C up terminating now) from March 2009. 3-wave moves are corrective, while 5-wave moves are impulsive. Even under the bullish case, where this wave C subdivides into 5 waves, We would be entering into a wave 2 down very shortly.

(please note, the drawings on these charts are not to scale, Wave C down could go much, much lower than the terminus of the line I have drawn on this chart)


The nature and extent of the next downtrend will tell us whether this is just a pullback within the bear market rally that started in March 2009, or the resumption of the larger bear market. I will post an update in a couple of months with, hopefully, an answer to that question. I wish all reading this blog a happy and prosperous 2011.